

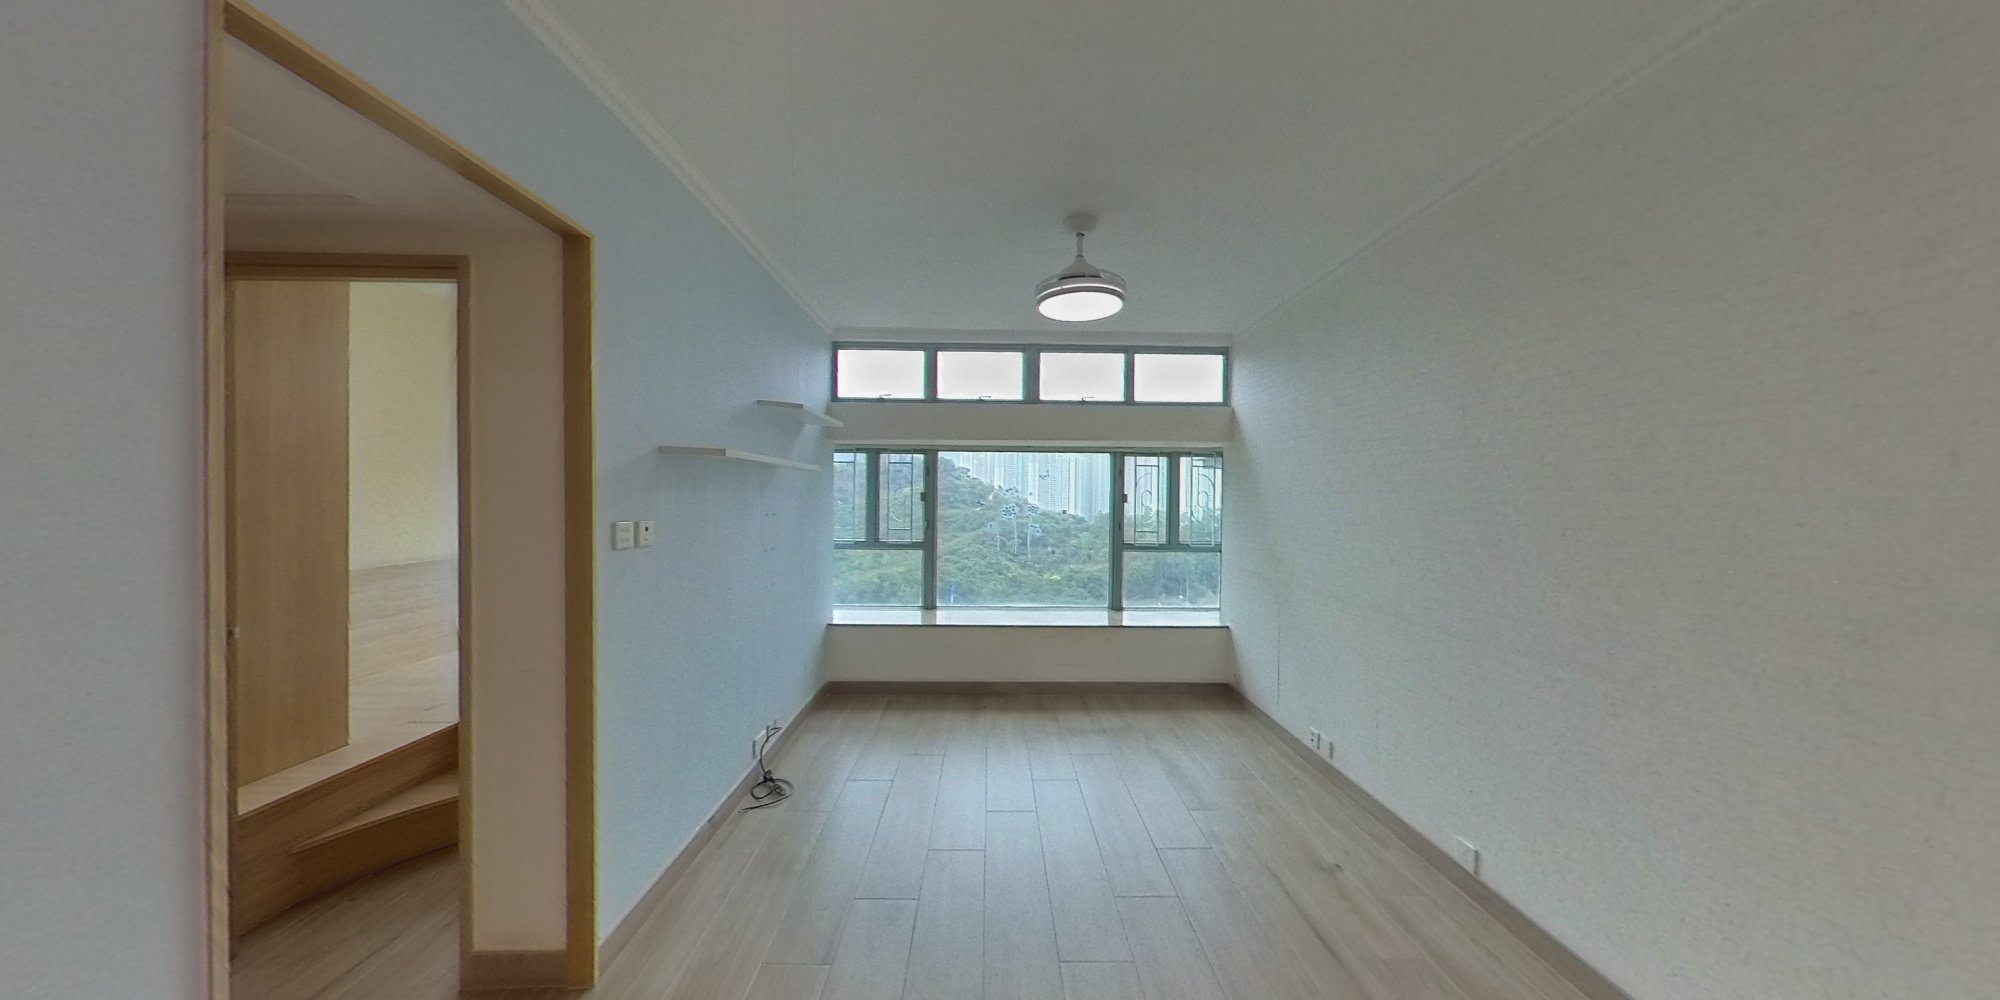
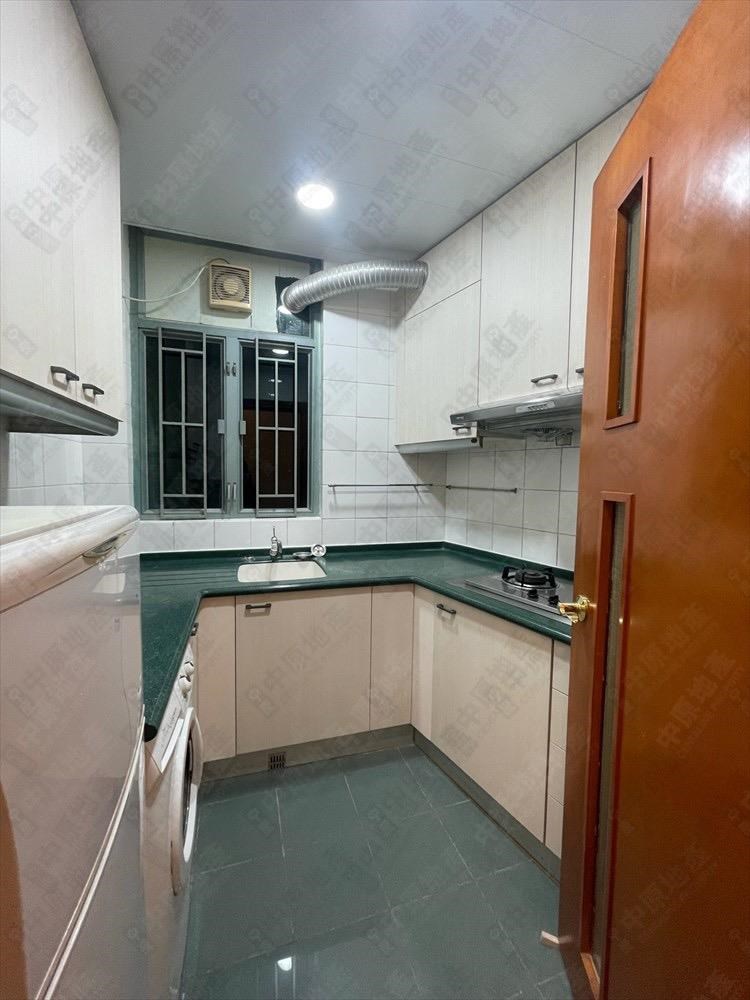
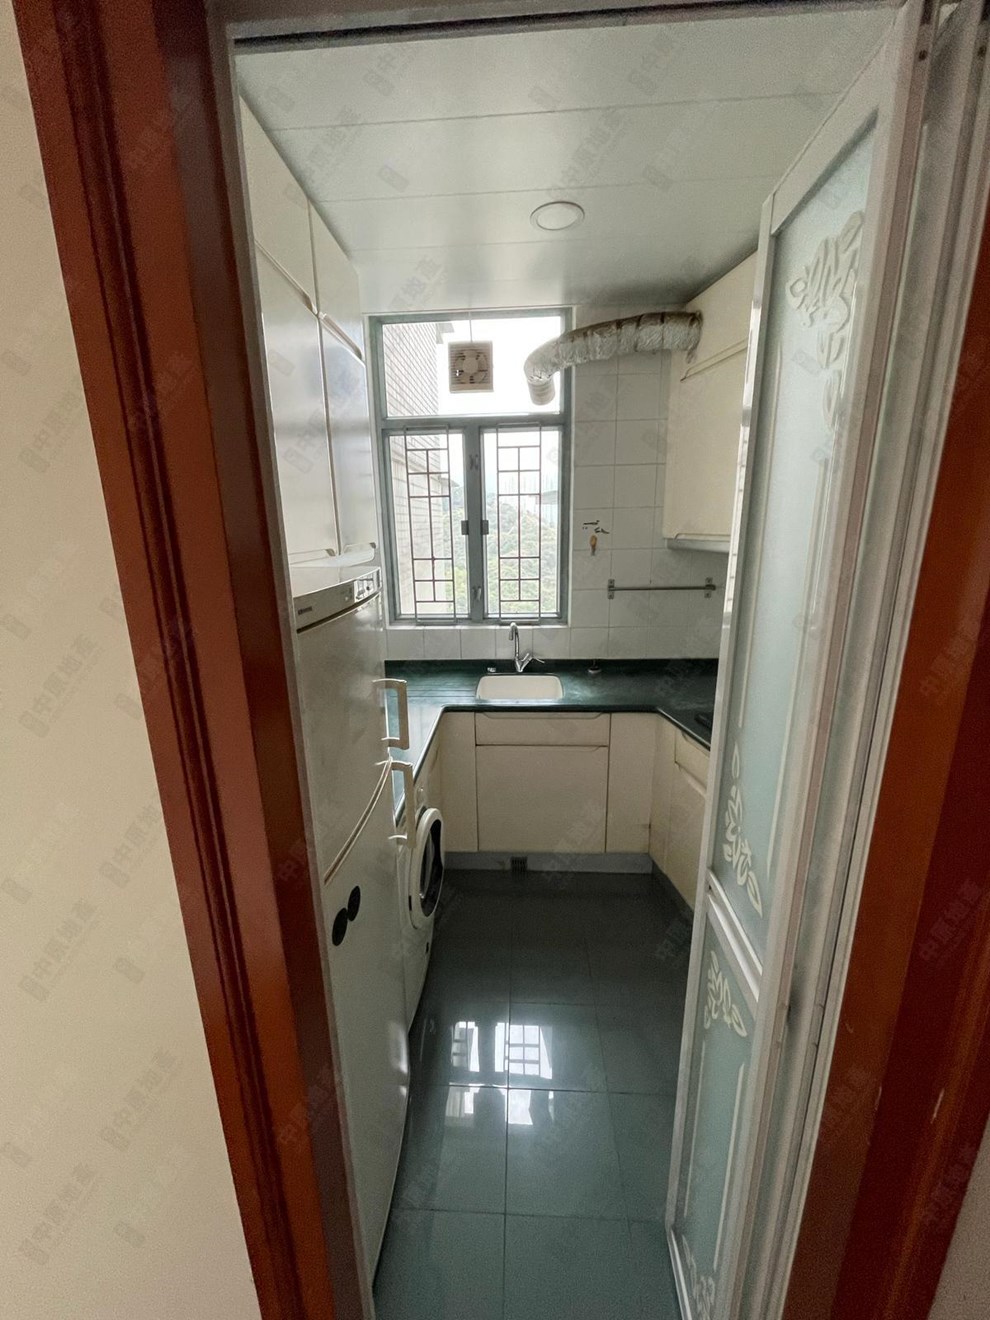
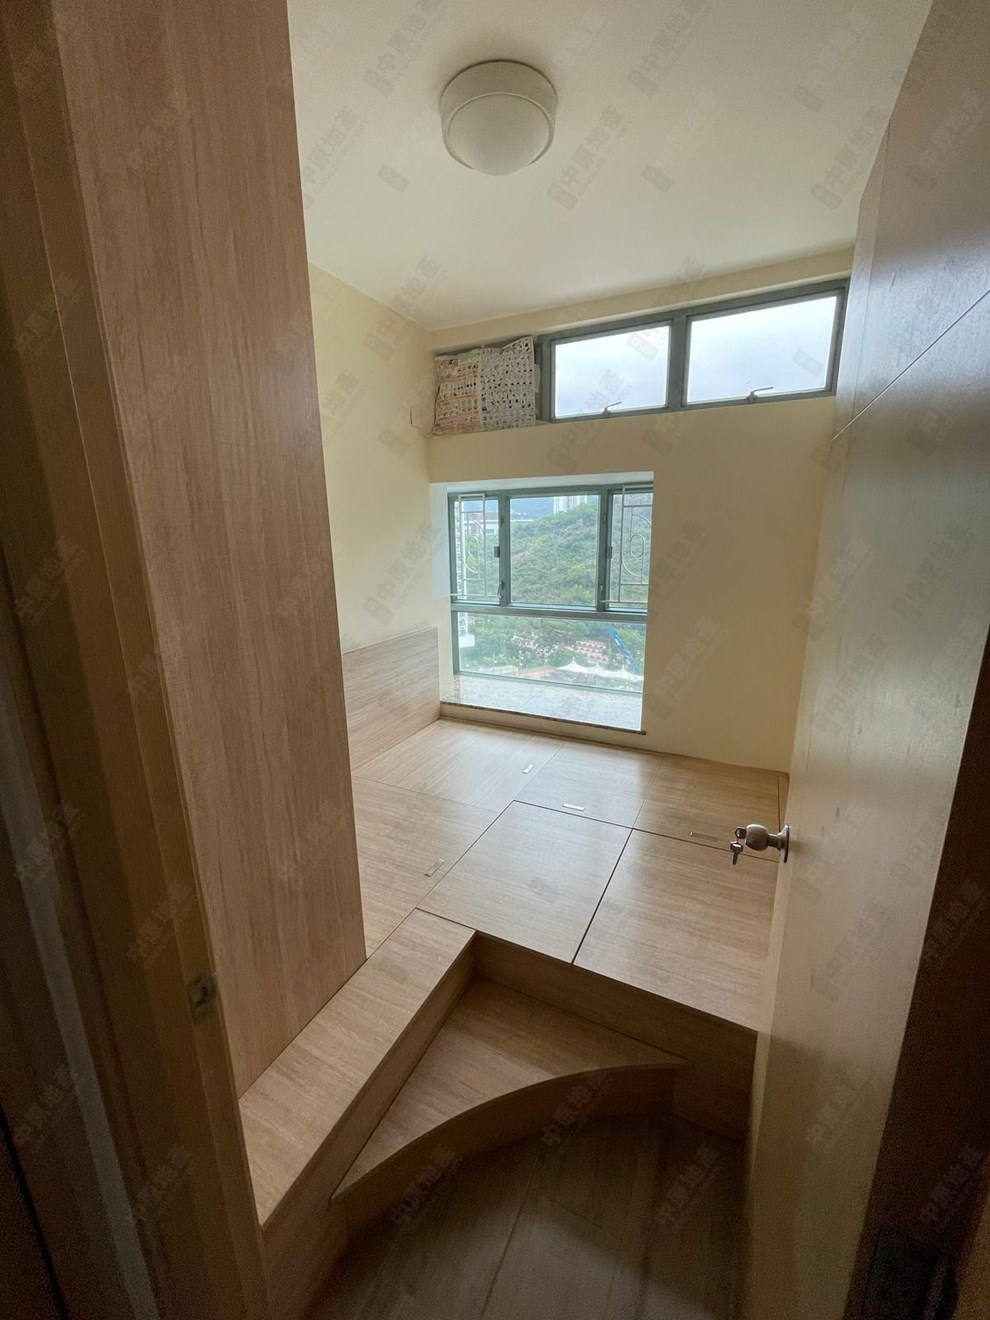
TUNG CHUNG CRESCENT・Phase 2・BLOCK 6 Low Floor・FLAT F
2 MEI TUNG STREET
Exclusive Key


TUNG CHUNG CRESCENT・Phase 2・BLOCK 6
TUNG CHUNG CRESCENT・Phase 2・BLOCK 6


TUNG CHUNG CRESCENT・Phase 2・BLOCK 6


Share
TUNG CHUNG CRESCENT・Phase 2・BLOCK 6
2 MEI TUNG STREET
Ref no.:FFE875 · Update Date:2025-03-13
Monthly:$22,569
S.A. 607 ft²
$11,828/ft²
GFA 832 ft²
$8,629/ft²
Room
2 Rm(s)
Efficiency(%)
73%
Age
25 Year(s)
Direction
South East
Features
Ref no.:FFE875 · Update Date:2025-03-13
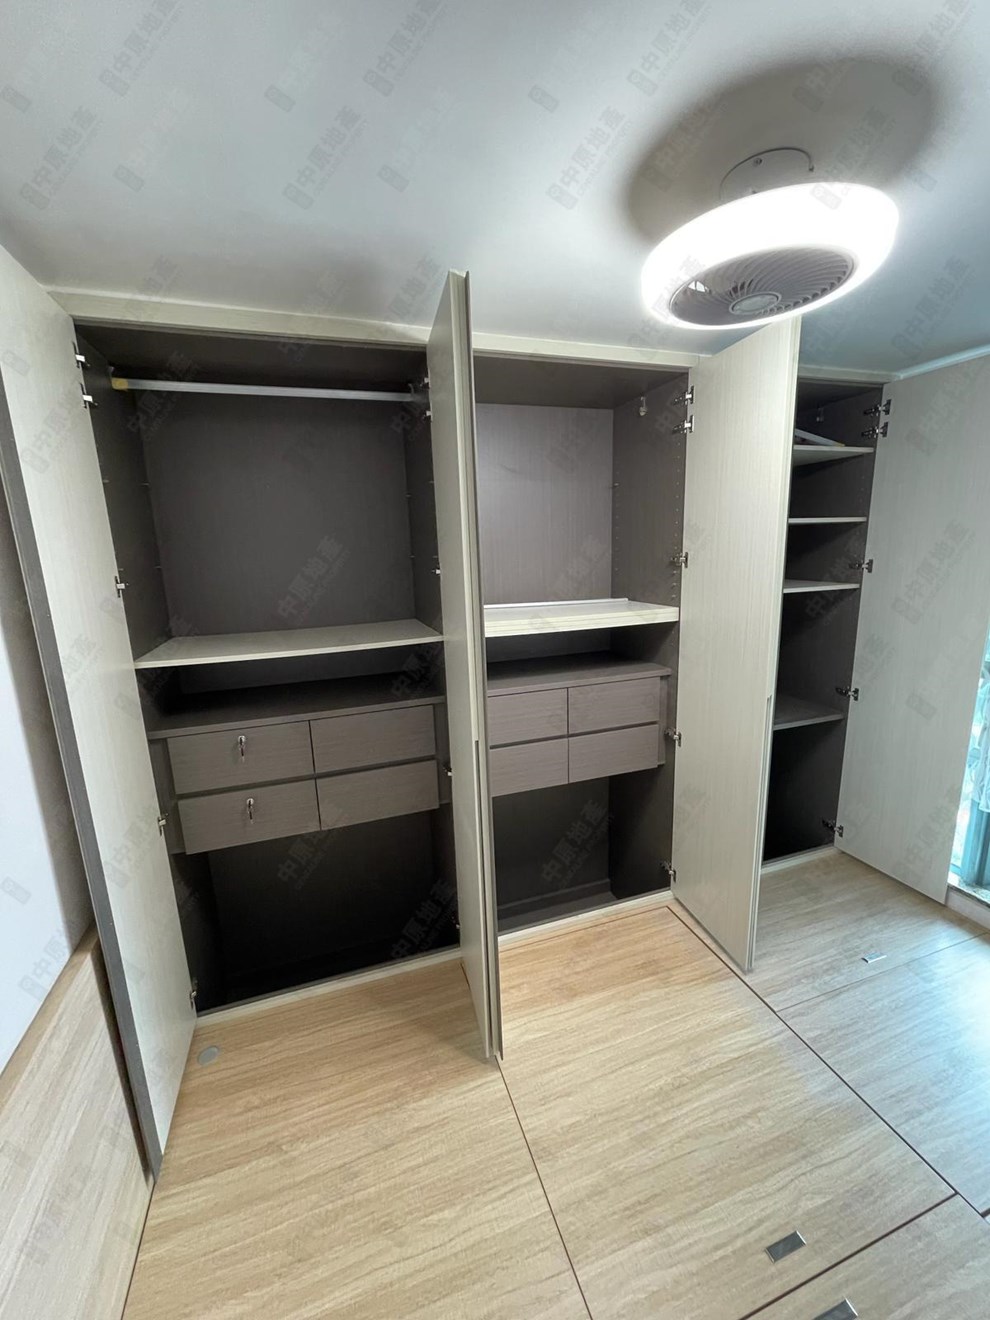
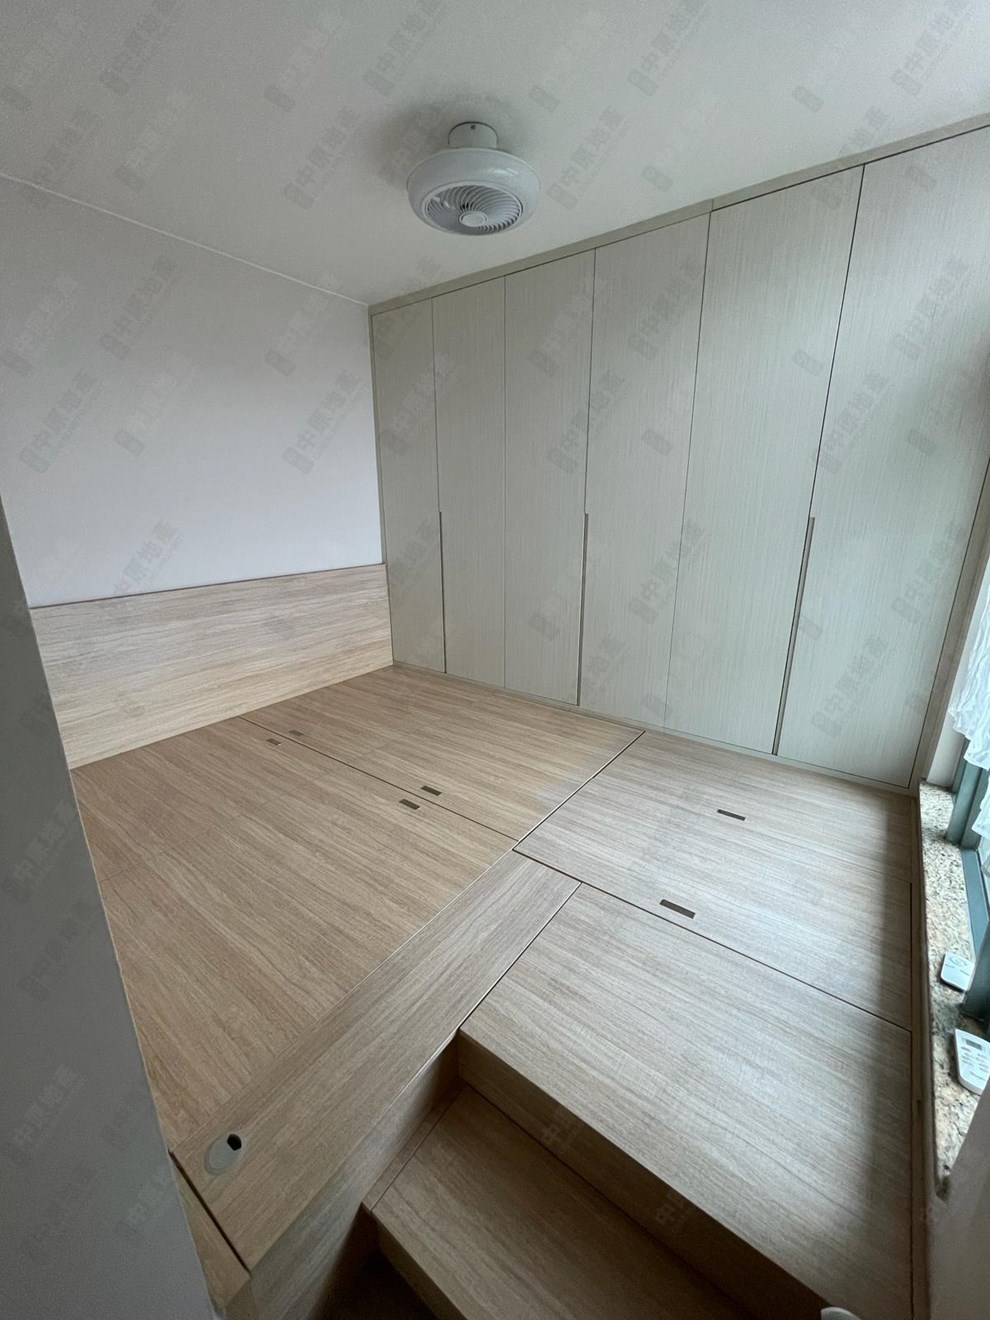
Good Layout & Efficient, Spacious Rooms

Jenny Chan
陳婉儀
S-388739


Property Valuation
Good Layout & Efficient, Spacious Rooms
Jenny Chan
陳婉儀
S-388739
| Date | Address | Floorplan | Transaction Price ($) | Area(S.A. |GFA) | Unit Rate(S.A. |GFA) | Source |
|---|---|---|---|---|---|---|
| 2025-03-12 |
Tung Chung Crescent・Phase 2・Block 6・Upper Floor・Flat C
| | Sold 6.2M |
607ft²
|
822ft²
|
$10,214/ft²
|
$7,543/ft²
| Centaline |
| 2025-01-16 |
Tung Chung Crescent・Phase 2・Block 6・23/F・Flat C
| | Sold 6.2M |
607ft²
|
827ft²
|
$10,214/ft²
|
$7,497/ft²
| Land Registry |
| 2024-12-20 |
Tung Chung Crescent・Phase 2・Block 6・Middle Floor・Flat C
| | Sold 6.2M |
607ft²
|
827ft²
|
$10,214/ft²
|
$7,497/ft²
| Centaline |
| 2024-12-16 |
Tung Chung Crescent・Phase 2・Block 6・20/F・Flat D
| | Sold 5.72M |
531ft²
|
724ft²
|
$10,772/ft²
|
$7,901/ft²
| Land Registry |
| 2024-11-15 |
Tung Chung Crescent・Phase 2・Block 6・20/F・Flat A
| | Sold 7.63M |
772ft²
|
1,062ft²
|
$9,883/ft²
|
$7,185/ft²
| Land Registry |
Tung Chung Crescent・Phase 2・Block 6・Upper Floor・Flat C
$6.2M
Centaline . 2025-03-12
S.A. 607ft²
@$10,214
GFA 822 ft²
@$7,543
Tung Chung Crescent・Phase 2・Block 6・23/F・Flat C
$6.2M
Land Registry . 2025-01-16
S.A. 607ft²
@$10,214
GFA 827 ft²
@$7,497
Tung Chung Crescent・Phase 2・Block 6・Middle Floor・Flat C
$6.2M
Centaline . 2024-12-20
S.A. 607ft²
@$10,214
GFA 827 ft²
@$7,497
Tung Chung Crescent・Phase 2・Block 6・20/F・Flat D
$5.72M
Land Registry . 2024-12-16
S.A. 531ft²
@$10,772
GFA 724 ft²
@$7,901
Tung Chung Crescent・Phase 2・Block 6・20/F・Flat A
$7.63M
Land Registry . 2024-11-15
S.A. 772ft²
@$9,883
GFA 1,062 ft²
@$7,185
Mortgage Calculator
Tung Chung Crescent Estate Information
More


Tung Chung Crescent Location
Tung Chung Town Centre, 2 MEI TUNG STREET
1) The Census and Statistics Department and Centamap is the sources of the boundaries of the Building Groups and Centamap is the source of the boundaries of the Housing Market Areas
2)The Government and Centamap are the Intellectual Property Rights owners of the boundaries of the Building Groups and Centamap is the Intellectual Property Rights owner of the boundaries of the Housing Market Areas