

Eltanin‧Square Mile


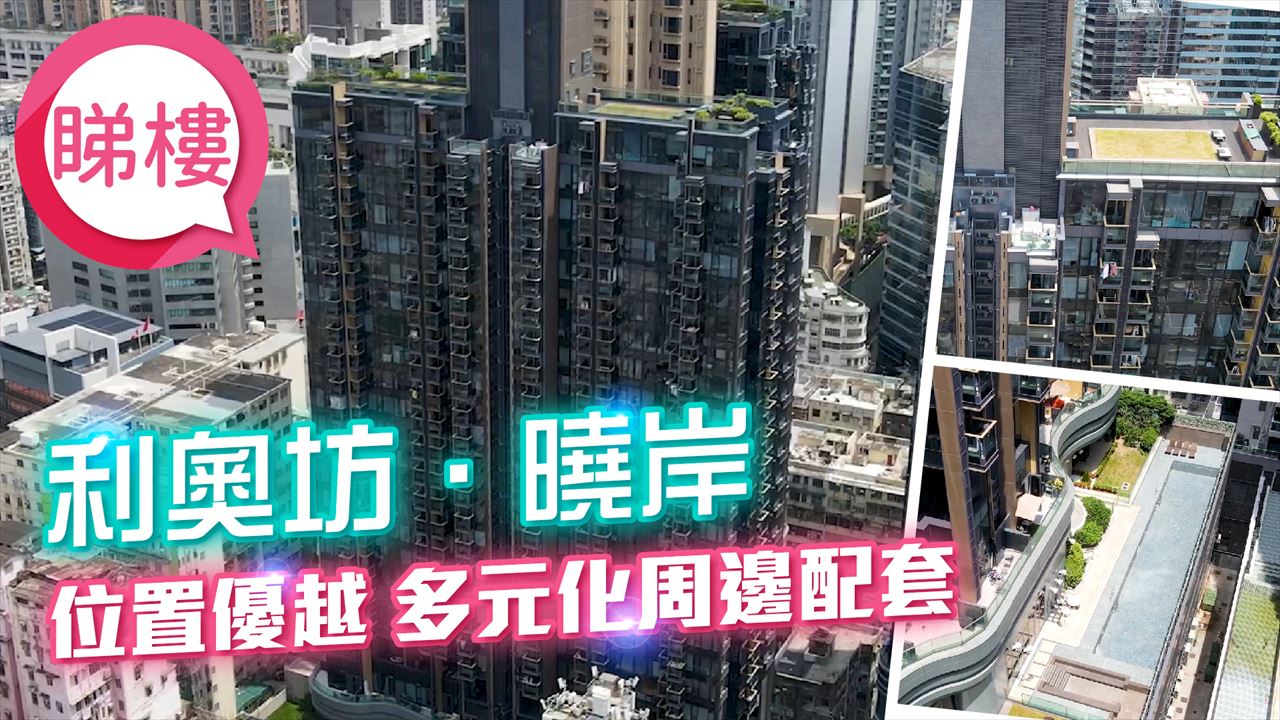

利奧坊.曉岸
利奧坊.曉岸


利奧坊.曉岸


Eltanin‧Square Mile Estate Info
2017/5
2 Block(s)
448
4 min(s)
Eltanin‧Square Mile Location
1) The Census and Statistics Department and Centamap is the sources of the boundaries of the Building Groups and Centamap is the source of the boundaries of the Housing Market Areas
2)The Government and Centamap are the Intellectual Property Rights owners of the boundaries of the Building Groups and Centamap is the Intellectual Property Rights owner of the boundaries of the Housing Market Areas
Eltanin‧Square Mile Price Trend
Eltanin‧Square Mile Transaction Records
| Date | Address | Rooms | Price | Saleable Area | Unit Rate | Source |
|---|---|---|---|---|---|---|
2025-10-28
|
Eltanin‧Square Mile Tower 2 25/F Flat G
|
1 Rm
|
$4M
|
255ft²
|
@$15,686
| Land Registry |
2025-09-12
 |
Eltanin‧Square Mile Tower 2 21/F Flat H
|
1 Rm
|
$4.37M
|
252ft²
|
@$17,341
| Land Registry |
2025-09-10
|
Eltanin‧Square Mile Tower 2 11/F Flat K
|
1 Rm
|
$4.18M
|
265ft²
|
@$15,774
| Land Registry |
2025-08-22
|
Eltanin‧Square Mile Tower 2 18/F Flat E
|
Studio
|
$3.23M
|
203ft²
|
@$15,911
| Land Registry |
2025-06-05
|
Eltanin‧Square Mile Tower 1 25/F Flat K
|
1 Rm
|
$3.98M
|
265ft²
|
@$15,019
| Land Registry |
2025-06-03
 |
Eltanin‧Square Mile Tower 2 8/F Flat A
|
2 Rm(s)
|
$5.75M
|
390ft²
|
@$14,744
| Land Registry |
2025-05-20
|
Eltanin‧Square Mile Tower 1 26/F Flat H
|
1 Rm
|
$3.8M
|
252ft²
|
@$15,079
| Land Registry |
2025-04-30
|
Eltanin‧Square Mile Tower 2 10/F Flat F
|
Studio
|
$3.15M
|
198ft²
|
@$15,909
| Land Registry |
2025-04-09
|
Eltanin‧Square Mile Tower 2 17/F Flat C
|
1 Rm
|
$4.25M
|
256ft²
|
@$16,602
| Land Registry |
2025-04-07
|
Eltanin‧Square Mile Tower 2 10/F Flat E
|
Studio
|
$3M
|
203ft²
|
@$14,778
| Land Registry |
Transaction History


Nearby Estates
Eltanin‧Square Mile | ||||
|---|---|---|---|---|
Price/ ft² by trans. (S.A.) in October
|
$16,525.096
- $27,659.574
|
$13,366.337
- $22,697.369
|
$11,983.471
- $14,876.033
|
$15,458.167
- $30,409.357
|
Year of Occupation Permit |
2017/05
|
2002/12
-
2003/08
|
1998/05
|
2019/12
|
No. of Units | 448 | 3,520 | 3,908 | 514 |
No. of Blocks | 2 | 10 | 18 | 2 |
School Net |
Primary:
32
Secondary:
Yau Tsim Mong District
|
Primary:
32
Secondary:
Yau Tsim Mong District
|
Primary:
31
Secondary:
Yau Tsim Mong District
|
Primary:
32
Secondary:
Yau Tsim Mong District
|
Monthly domestic household income (Indicated in HKD) |
--
|
$39,580
|
$40,930
|
--
|
Household size |
--
|
2.4
|
3
|
--
|
Median age | -- | 41.1 | 48.5 | -- |
Median monthly household rent (Indicated in HKD) | -- | $15,000 | $18,500 | -- |
Eltanin‧Square Mile Recommendations
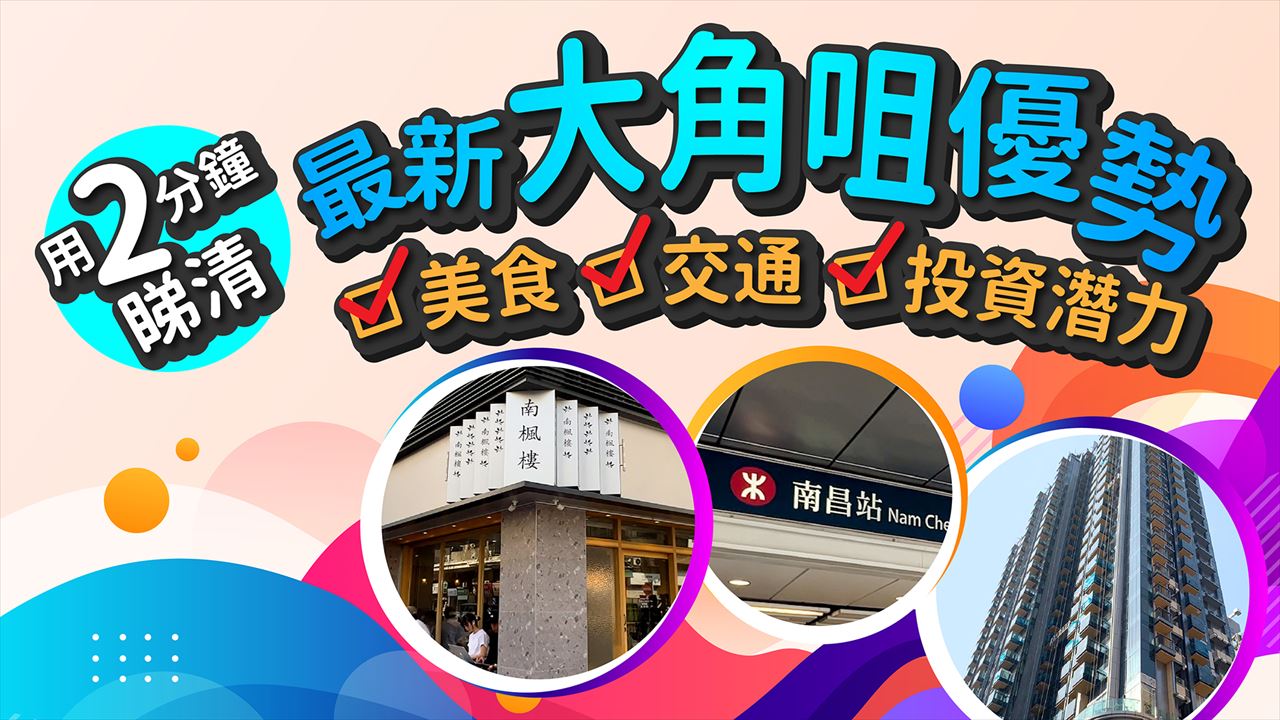
Tai Kok Tsui @HMA
There are 22,068 private residential units, involving 74,645 population in Tai Kok Tsui(Yau Tsim Mong District).Major streets included Hoi Ting Road(Tai Kok Tsui Section)、Tung Chau Street(Tai Kok Tsui Section)、Prince Edward Road West(Tai Kok Tsui Section). Major estates include Metro Harbour View,Cosmopolitan Estates,Charming Garden,Hoi Fu Court,Fu Tor Loy Sun Chuen.The median of monthly income of the district is HK$ 27,170 with a median age of 45.6.

Agents


Branches
 Olympian Station The Quinn.Square Mile BranchShop G107, G/F., The Quinn.Square Mile, No. 5 Sham Mong Road, Tai Kok?Tsui,?Kowloon
 Olympian Station Gateway.Square Mile BranchShop No. 1, G/F., Tai Lee Building, No. 31 Kok Cheung Street, Tai Kok Tsui, Kowloon
 Olympian Station Harbour Green Branch Team AShops 4B & 4D, G/F., Tai Chuen Building, Nos. 88-102 Ivy Street, Tai Kok Tsui, Kowloon
 Olympian Station Florient Rise Branch Team AShop 202A, 2/F., West9zone, No. 38 Cherry Street, Tai Kok Tsui, Kowloon